Since July 6, 2023, Atlassian has no longer been used for Release Notes or knowledge base articles.
* Find Release Notes here (https://support.mycontactcenter.net/app/articles/detail/a_id/23378/) and articles here (https://support.mycontactcenter.net/app/main).
* Authenticated Partners can access content here (https://support.mycontactcenter.net/cc/sso/authenticator/oauth/authorize/imcontrolpanel?redirect=main&source=mycontactcenter)
Call Volume
- Larry Brown (Deactivated)
- cjeintermedia (Unlicensed)
- Jela Banovic (Deactivated)
- Former user (Deleted)
This is a graphical illustration of when average, minimum, and maximum call volumes occur each day for the selected queue.
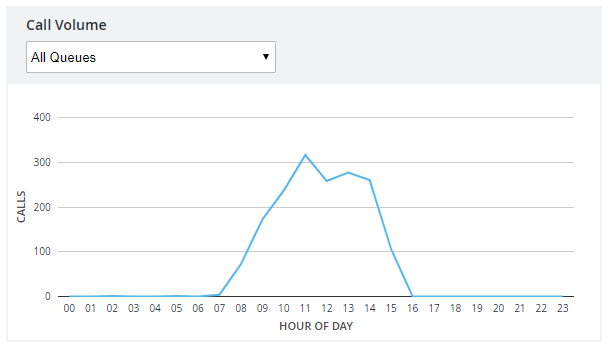
Call volume is measured as follows:
- x-axis (00, 01, 02) − Indicates the time in seconds.
- y-axis (0, 5, 10) − Indicates the number of calls.
Related content
Since July 6, 2023, Atlassian has no longer been used for Release Notes or knowledge base articles.
* Find Release Notes here (https://support.mycontactcenter.net/app/articles/detail/a_id/23378/) and articles here (https://support.mycontactcenter.net/app/main).
* Authenticated Partners can access content here (https://support.mycontactcenter.net/cc/sso/authenticator/oauth/authorize/imcontrolpanel?redirect=main&source=mycontactcenter)