Since July 6, 2023, Atlassian has no longer been used for Release Notes or knowledge base articles.
* Find Release Notes here (https://support.mycontactcenter.net/app/articles/detail/a_id/23378/) and articles here (https://support.mycontactcenter.net/app/main).
* Authenticated Partners can access content here (https://support.mycontactcenter.net/cc/sso/authenticator/oauth/authorize/imcontrolpanel?redirect=main&source=mycontactcenter)
Filtering Call Center Metrics
Information represented in the dashboard display graphics can be filtered to display call metrics totals by queue, all queues, team, or all teams. The following list indicates the type of filtering available for each metric (see table below).
| Metric | Filter Type |
|---|---|
| Call Center Metrics | Queue |
| Service Level | Queue |
| Call Volume | Queue |
| Agent Activity | Team |
| Call Classification | Queue |
| Call Distribution | No Filter |
Note: Filtering is not available for Call Distribution, since this infographic is providing an overall view of which queues the calls have been distributed to for the current day, therefore you do not want to display call distribution for only one queue.
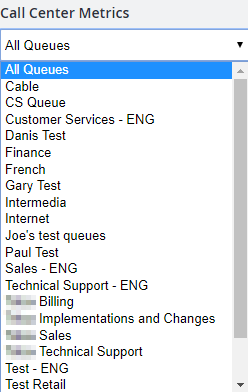
To select which queue metrics you want to view:
- Click on the drop-down menu Queue at the top of each infographic.
- Select a Queue or Team name from the list.
- The Dashboard will automatically display metrics for the queue selected.
Since July 6, 2023, Atlassian has no longer been used for Release Notes or knowledge base articles.
* Find Release Notes here (https://support.mycontactcenter.net/app/articles/detail/a_id/23378/) and articles here (https://support.mycontactcenter.net/app/main).
* Authenticated Partners can access content here (https://support.mycontactcenter.net/cc/sso/authenticator/oauth/authorize/imcontrolpanel?redirect=main&source=mycontactcenter)