Since July 6, 2023, Atlassian has no longer been used for Release Notes or knowledge base articles.
* Find Release Notes here (https://support.mycontactcenter.net/app/articles/detail/a_id/23378/) and articles here (https://support.mycontactcenter.net/app/main).
* Authenticated Partners can access content here (https://support.mycontactcenter.net/cc/sso/authenticator/oauth/authorize/imcontrolpanel?redirect=main&source=mycontactcenter)
Dashboard Settings
- Larry Brown (Deactivated)
- cjeintermedia (Unlicensed)
- Jela Banovic (Deactivated)
- Former user (Deleted)
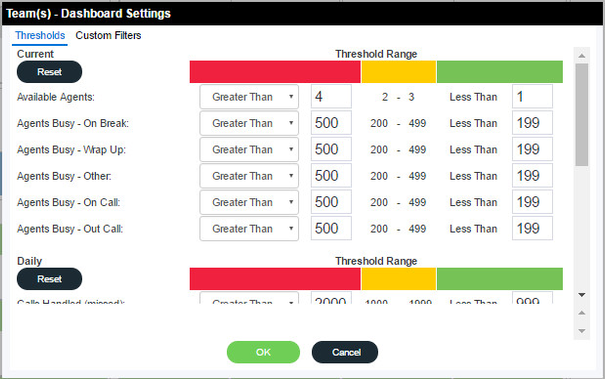
The Dashboard Settings allow you to change the threshold alert settings for the dashboard for each available filter view.
To view or edit the Dashboard Settings:
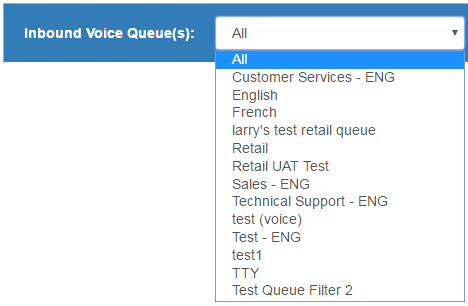
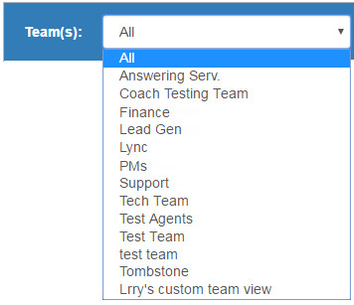
- Select the Queue or Team filter settings you wish to view or change from the appropriate Filter drop-down menu (depending on which settings you want to view/ update).
- Next click
 or
or  .
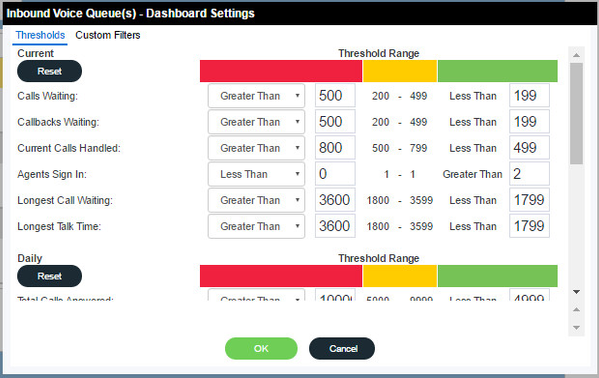
. - The Dashboard Settings dialog box opens. The dialog box is comprised of two tabs: Thresholds and Custom Filters.
- Click the Thresholds tab to change the threshold alert settings for the dashboard and click the Custom Filters tab to apply custom filter names to the filter list.
Threshold Alert Settings
Threshold Alert Settings are viewed and edited from the Metrics Dashboard page.
Note: Separate buttons exist for Queue Dashboard Settings and Team Dashboard Settings. Select the appropriate button depending on which settings you wish to edit.
To Edit Thresholds:
- Click or .
- The Dashboard Settings dialog box opens. If not already selected, click the Thresholds tab.
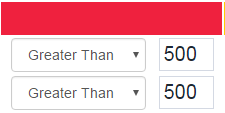
- First, enter the Red Threshold Values.
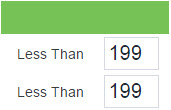
- Next, enter the Green Threshold Values.
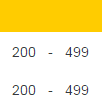
- Once both red and green values are entered, the Amber Threshold Values are automatically calculated.
- Once all threshold values are complete, click OK.

Custom Filters
Custom Filters are updated from the Metrics Dashboard page. Custom filters can be applied to individual queues or groups of queues.
Note: Separate buttons exist for Queue Dashboard Settings and Team Dashboard Settings. Select the appropriate button depending on which settings you wish to edit.
- Click or .
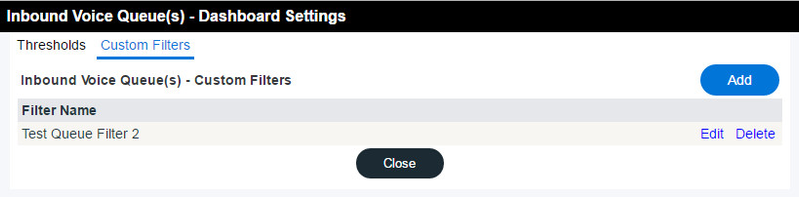
- The Dashboard Settings dialog box opens.
- If not already selected, click the Custom Filters tab. Click Add.
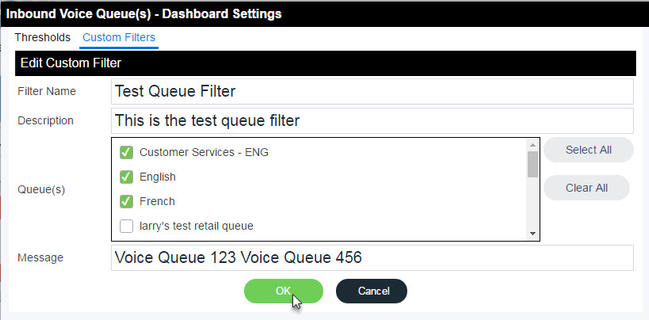
- The Add Custom Filter dialog box opens. Complete all fields and select one or more Queues (right side of the page) or Queue Groups (left side of the page). A checkmark appears beside the selected queues or queue groups (all queues assigned to the selected queue group). Click OK (see Custom Filter fields defined below).
Groups are for selection purposes only, to enable the selection of multiple queues as parameters or assignments or activation. When groups are selected, the group is not the entity that gets selected or deselected, but rather it is the members of that group at the time of selection or deselection that are selected or deselected. For example, if a custom filter is applied to a group of queues, the group selects all queues in that group. If the group is modified, the deselection only removes queues in that group at the time of deselection.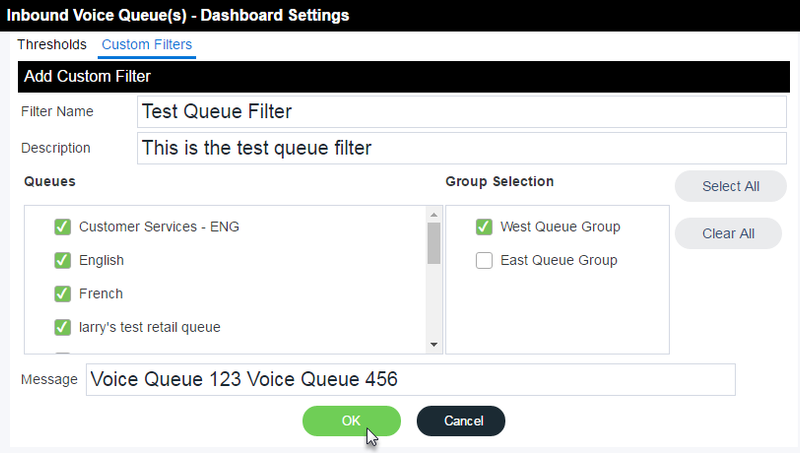
Custom Filter fields are as follow:- Filter Name – Enter the name for your custom filter.
- Description – Enter a description for your custom filter.
- Queues or Group – Select the Queue or Queue Group you wish to apply the custom filter to. Click Select All to select all Queue(s); this will apply the custom filter to all the queues or teams. To clear all selected Queue(s), click Clear All and then select only the queues or teams you wish to apply the filter to.
- Messages – Enter a message to display on the Metrics Dashboard Home page; any message entered here will appear as a scrolling message in the appropriate section: Inbound Queue(s) or Team(s).
- The custom filter appears in the Filter table. Click Close to return to the Metrics Dashboard Home page.
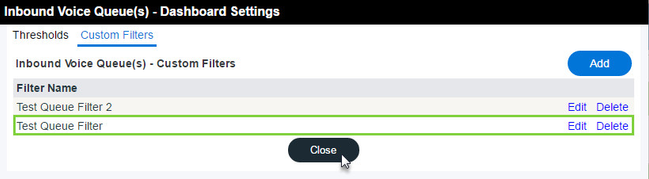
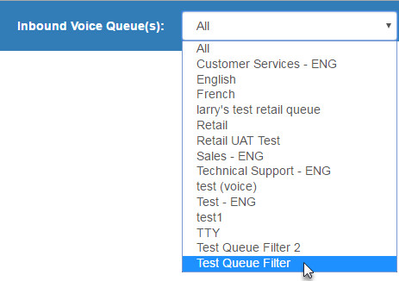
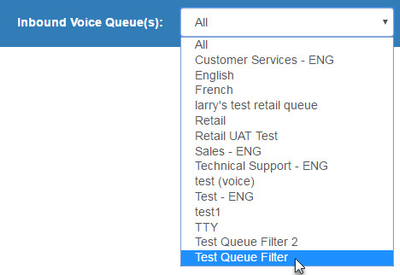
- The custom filter now appears in the Inbound Voice Queue(s) or Team(s) drop-down menu, depending on where the custom filter was created.
Note: When making changes to a Queue Group to which a custom filter has been applied to previously, always click Deactivate this bulletin in all queues and then re-select the Queue Group to ensure the queue group changes are updated, otherwise, the queues assigned to the queue group will not reflect the changes made to the selected queue group.
- Click or .
- The Dashboard Settings dialog box opens.
- If not already selected, click the Custom Filters tab.
- Click Edit.
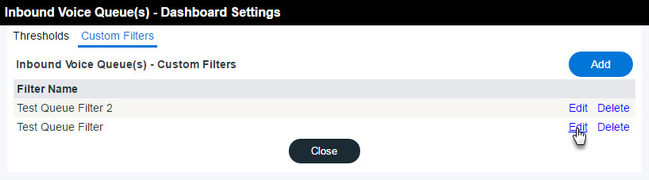
- The Edit Custom Filters dialog box opens. Edit the required fields and click OK.
- Click Close from the Dashboard Settings dialog box to return to the Dashboard Settings Home page.
- The new custom filter appears in the filter drop-down menu. You may experience a 1-2 minute delay before the new filter appears in the drop-down menu.
Related content
Since July 6, 2023, Atlassian has no longer been used for Release Notes or knowledge base articles.
* Find Release Notes here (https://support.mycontactcenter.net/app/articles/detail/a_id/23378/) and articles here (https://support.mycontactcenter.net/app/main).
* Authenticated Partners can access content here (https://support.mycontactcenter.net/cc/sso/authenticator/oauth/authorize/imcontrolpanel?redirect=main&source=mycontactcenter)