This is the second panel in the Monitoring page.
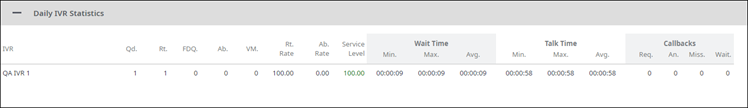
The Daily IVR Statistics panel lists all IVRs and can be sorted by clicking any of the underlined column headings. The following metrics are displayed for each IVR:
- Qd. (Queued): Total number of calls queued
- Rt. (Routed): Total number of calls routed
- Ab. (Abandoned): Total number of calls abandoned (not answered)
- VM. (Voicemail): Total number of calls answered by voicemail
- Rt. Rate (Calls Routed Rate): Percentage of calls routed
- Ab. Rate (Abandoned Rate): Percentage of calls abandoned (not answered)
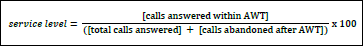
- Service Level: Percentage of calls answered within the Acceptable Waiting Time (AWT) set on the Queues screen. Calls abandoned after the acceptable waiting time will also impact the service level, per the formula below:
- Wait Time: Time callers have waited in queue (does not include hold time)
- Min.: Minimum wait time
- Max.: Maximum wait time
- Avg.: Average wait time
- Talk Time: Time callers have spent speaking with a representative (including any time put on hold)
- Min.: Minimum talk time
- Max.: Maximum talk time
- Avg.: Average talk time
- Callbacks: Time agents spent calling back clients
- Req.: Number of callbacks requested
- An.: Number of callbacks answered
- Miss.: Number of callbacks missed
- Wait: Number of callbacks left waiting