
This panel will list all queues within IVRs and can be sorted by clicking any of the underlined column headings. The following metrics are displayed for each queue:
- Qd. (Queued) – Total number of calls queued.
- Rt. (Routed) – Total number of calls routed.
- Ab. (Abandoned) – Total number of calls abandoned (not answered).
- VM. (Voicemail) – Total number of calls answered by voicemail.
- Rt. Rate (Routed Rate) – Percentage of calls routed.
- Ab. Rate (Abandoned Rate) – Percentage of calls abandoned (not answered).
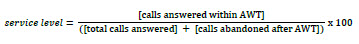
- Service Level – Percentage of calls answered within the Acceptable Waiting Time (AWT) set on the Queues screen. Calls abandoned after the acceptable waiting time will also impact the service level, see formula:
- Wait Time – Time callers have waited in queue (does not include hold time).
- Min. – Minimum wait time.
- Max. – Maximum wait time.
- Avg. – Average wait time.
- Talk Time – Time callers have spent speaking with a representative (including any time put on hold).
- Min. – Minimum talk time.
- Max. – Maximum talk time.
- Avg. – Average talk time.