This is a graphical illustration of when average, minimum, and maximum call volumes occur each day for the selected queue.

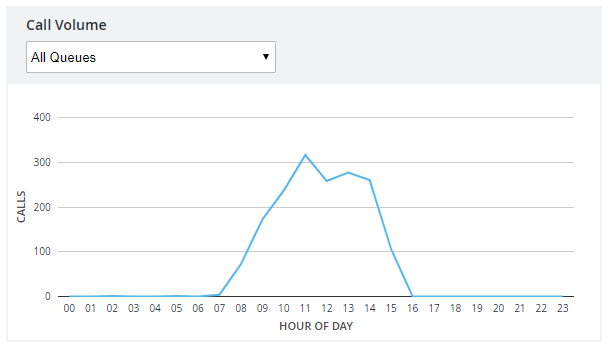
Call volume is measured as follows:
- x-axis (00, 01, 02): Indicates − Indicates the time in seconds.
- y-axis (0, 5, 10): Indicates − Indicates the number of calls.