Larry Brown
Former user
Dec 17, 2018
Nov 29, 2019
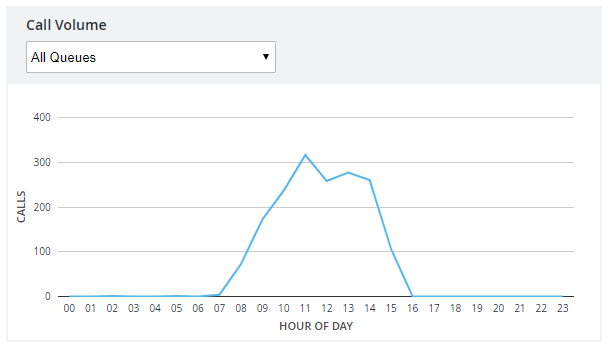
This is a graphical illustration of when average, minimum and maximum call volumes occur each day for the selected queue.
Image RemovedImage Added
Call volume is measured as follows:
...